

Stock market analysis is inherently complicated.
When you’re trying to predict the future movement of a stock price, you must consider a lot of technical data. This includes historical data, prevailing and future trends, market sentiment, and the stock’s fundamentals.
But with the right charting software or platform, you’re a step closer to nailing market analysis, despite its complex nature. In this article, I walk you through the five (5) best stock market analysis platforms in 2024.
We’ll consider the analysis tools offered, the capability for multiple technical indicators analysis, and what sets them apart from other stock charting platforms.
See if one of these stock analysis platforms suits your trading objectives and financial goals.
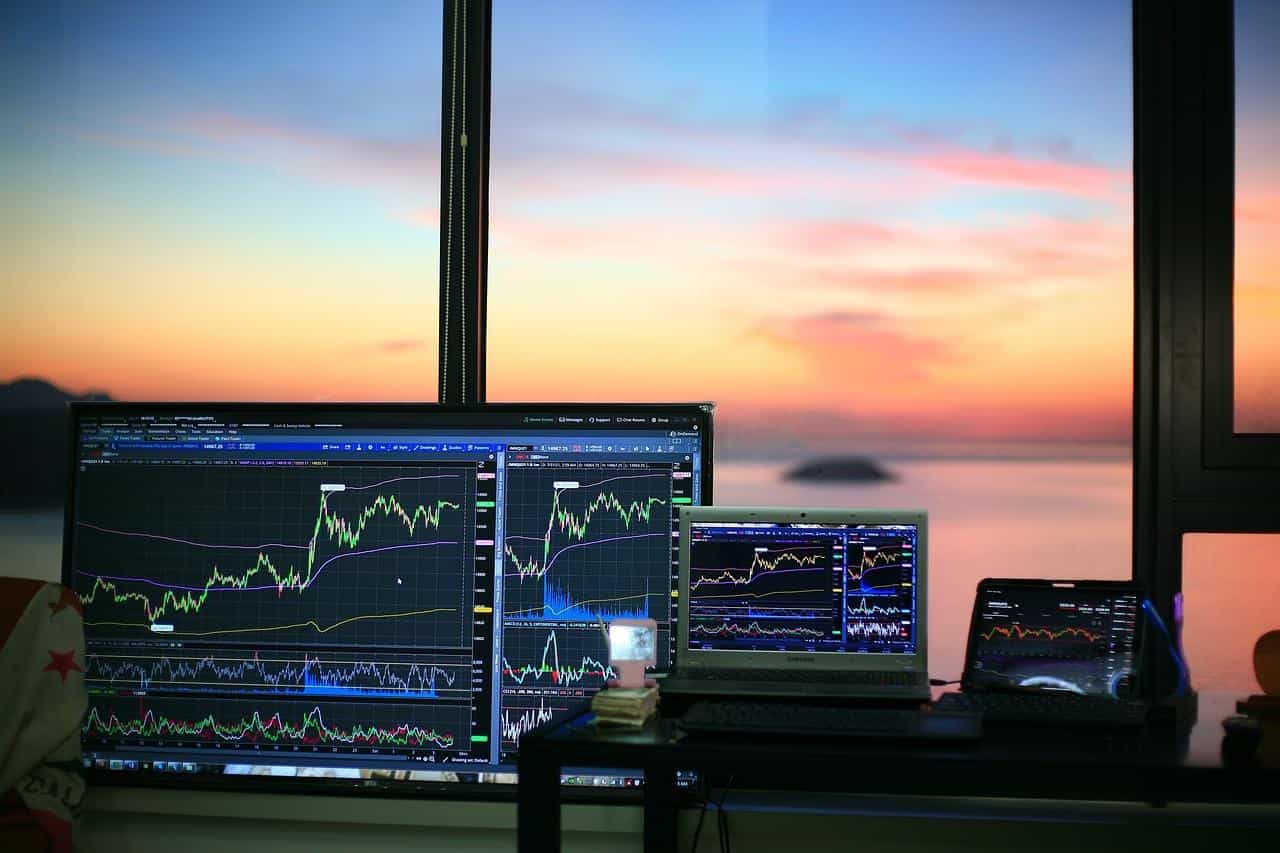
Top 5 Stock Market Analysis Platforms in 2024
Trade the market
That’s the common phrase embodied by stock traders. Simply put, you have to analyze the market to position your trade correctly—with high chance of profiting from it. This includes the analysis of historical data and prevailing trends, as well as the prediction of potential market movement and direction.
Sounds a lot? It really is.
But with the right stock market analysis platform, you rise above the complex stock market analysis and profit from it. Here are the 5 charting and analysis platforms that hold the preference of stock traders in 2024.
#1. TradingView
TradingView is one of the most popular charting platforms for traders, investors, speculators, and even those who just want to see what’s going on with the financial market.
Mind you, TradingView caters not only to stock traders but also to other financial market traders, such as forex, cryptocurrency, commodities, and indices.
This popularity was rooted in its accessibility, user-friendliness, and extreme affordability. With its intuitive interface, even beginner traders can use and understand it with a few maneuvers. It’s also affordable because you can access thousands of charting tools, technical indicators, and trading benefits for a subscription fee of as little as $0, with a ceiling price of only $59.95 per month.
One great thing about this technical analysis software is its interactive, insightful, and resourceful community. It has social trading features like chatrooms, forums, and news feeds, which are crucial to analyzing the stock market. Users can also share and access community-generated trading alerts, technical indicators, and trading strategies for social trading.
#2. NinjaTrader
While NinjaTraders is often associated with forex and futures trading, you can also use this platform to analyze equity or stock markets. Its customizable, user-friendly, and real-time chart makes stock market analysis smooth.
However, its charting platform is only available to NinjaTraders’ funded accounts and its supported brokers.
If you’re a NinjaTrader premium user, you can access the Order Flow+ suite. This access allows you to use a suite of premium features for a more advanced stock market analysis, including:
- Order Flow
- Volume Bars
- Market Depth
It also innovates the Chart Trader, a chart-based entry tool. This innovation is ideal for those who want to place and manage trade positions directly from the chart. This ultimately allows swift execution by eliminating the need to switch from one screen to another just to execute orders.
Lastly, NinjaTrader provides its users with real-time stock market data through Kinetick. This service distributes free End of Day (EOD) market data for stocks, futures, and forex traders and analysts.
#3. TrendSpider
TrendSpider offers a wide array of stock analysis tools that assist you in finding, planning, and timing your equity trades with increased efficiency and precision.
It offers automatic features including trendline detection, Fibonacci retracement, Japanese candlestick detection, and price alerts. It also provides AI-assisted technical know-how to traders and analysts to further assist them in monitoring the global equity market.
With these features, stock analysts and traders are becoming increasingly fond of TrendSpider, despite its relative newness to the market.
However, most new users and beginner traders might experience learning curve due to the depth, complexity, and overwhelming platform interface.
The monthly subscription ranges from $17 to $135. Unfortunately, TrendSpider doesn’t offer a free account. However, there is a discount for annual plans, which goes up to around $5 monthly.
#4. MetaStocks
With MetaStocks, you can scam the global equity market, backtest your trading tools, strategy, and system, as well as generate buy and sell signals.
MetaStock offers 300+ stock charts and technical analysis indicators and is popular due to its robust backtesting and forecasting capabilities.
However, what really keeps this charting platform from entering the mainstream is its outdated, old-school Windows app design. Given its price, users may expect a more modern, or at least customizable charting from their subscription.
MetaStock Daily Chart (D/C) provides its subscribers with end-of-day (EOD) stock market data, while the MetaStock Real-Time (R/T) incorporates real-time intraday Refinitiv data.
Note: Refinitiv is a major provider of financial market data and infrastructure.
Ticker Tocker
Ticker Tocker is a social network and research platform where traders have access to knowledge, tools, and resources from the community. More so, its automated trading offering adds up to its value in providing a more convenient, more advanced, and easier approach to stock trading and analysis.
While Ticker Tocker offers valuable tools, indicators, and resources to technical stock traders and analysts, it somehow falls into the expensive spectrum of trading platforms. Also, upon investigation, we found that the interface of Ticker Tocker is far from intuitive. New users may have to invest a significant amount of time just to be familiarized with how the platform works and how to make the most out of it.
It offers trading education, research, and automated trading. However, compared to other platforms in its price range, its users may expect a better charting experience.
Traders comfortable trading by themselves can use its code-free algorithm generator to design and implement their own automated trading strategies and systems, like entry and exit points.
Is Yahoo!Finance an Analysis Platform?
No, Yahoo!Finance is not an analysis platform. It’s a news provider, not an analysis platform where you can draw trendlines, monitor price movement, or anything else.
But that doesn’t mean Yahoo!Finance is not crucial for stock traders and analysts. It is one of the most credible and trusted news providers by professional analysts. So, you’re missing out if you’re not using it.
Ultimately, it allows you to analyze the market fundamentals by publishing and consolidating news into one news feed. Here is the common news that you can find on Yahoo!Finance:
- Financial, political, and global economy news
- Company data
- News Commentary
- Stock quotes
- Press quotes
- Financial data and reports
- Company cash flow (inflow and outflow)
Moreover, what I like about it is its comprehensive performance preview of the stock market performance. Its ranking of the most active, gainer, and loser stocks is a great reference for gauging global equity movement and performance.
Picking Among the Best Stock Market Analysis Platforms
If you want to pick one among the sea of stock market analysis platforms, there are tons to consider. There’s the interface’s intuitiveness, affordability, functionality, features offered, and many more! One might say doing this is like finding a needle in a haystack.
But really, all you have to do is assess whether you can afford, understand, maximize, and enjoy the analysis platform. While these five stock analysis platforms are generally proven to provide traders with enough resources and benefits to trade stocks, finding the ‘best one effectively‘ still lies on you.